BTC. ETH. Market Cap. One platform.
Price, volume, and market cap across the assets that move portfolios — timeframe controls, overlay data, and no routing to third-party tools that break your workflow.
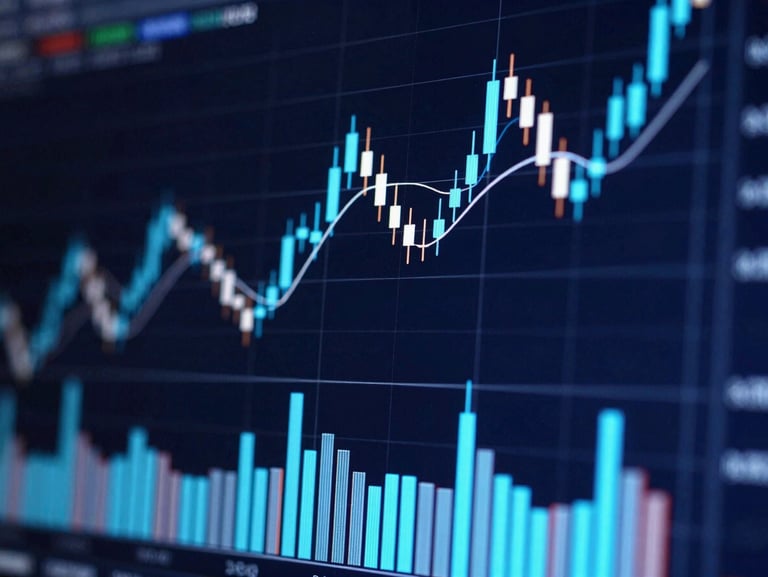

BTC with volume and accumulation overlays
On-chain volume bars and exchange netflow overlays expose institutional accumulation and distribution cycles as they develop — not after the fact.
Timeframe controls span 1H to 3Y. Switch between log and linear scale to read trend structure across both short-term momentum and long-cycle context.


Total cap and top-coin comparisons
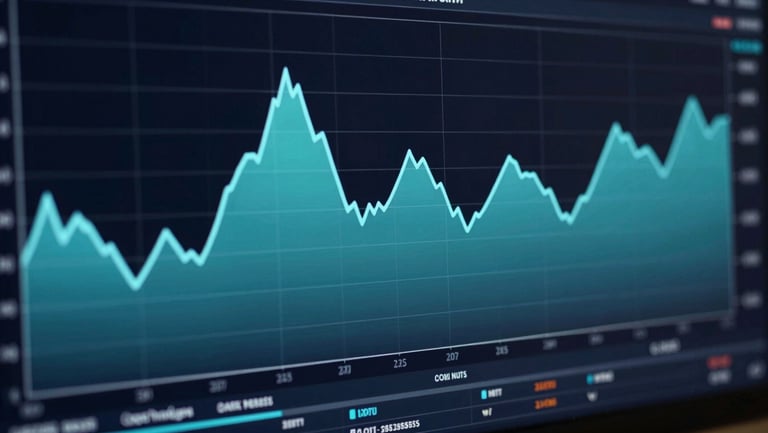
Total Market Capitalization
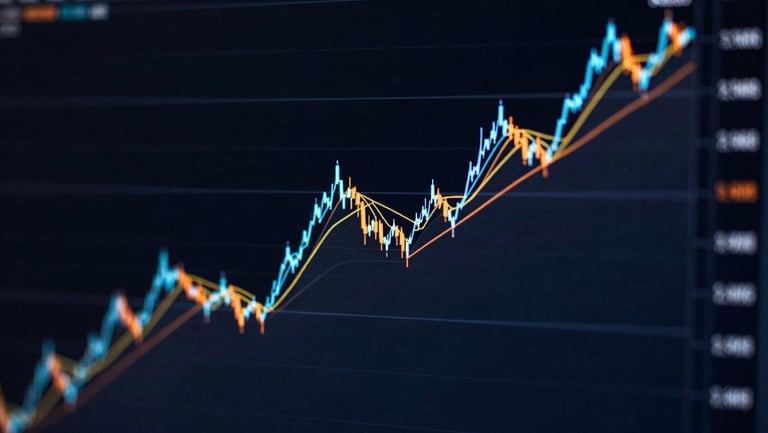
BTC vs ETH vs SOL Comparison
Global crypto market cap charted against 24h volume to surface macro inflow and outflow trends. Identify cycle tops and compression phases before they resolve.
Normalized multi-asset price comparison reveals relative strength and capital rotation across the largest-cap assets within a single selectable timeframe.
Charts confirm what the data already shows
Pair chart patterns with institutional-grade research reports, on-chain deep-dives, and macro outlooks — all within ChainSignal.